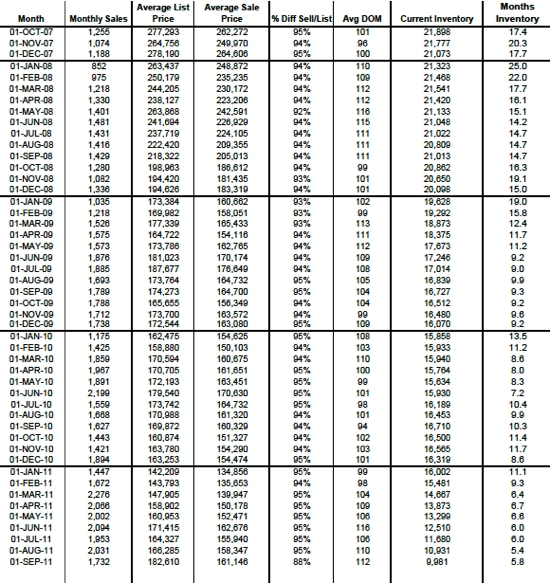
Another month of interesting stats here in the Greater Tampa Bay area! The chart above shows a 4 year history back to October of 2007. A couple of things you’ll immediately notice:
1. We are at 5.8 months of inventory. 6 months is considered a “normal” market – neither a buyers market nor a seller’s market. We are teetering back into a Seller’s market dipping below the 6 mark.
2. Our current inventory is at 9,981 homes. This is THE LOWEST our inventory has been in over 4 years.
3. The List to Sell Ratio dropped to 88%, when its been hovering between 94-95% for the last year or more. This is because for some reason, Sellers raised their average listing price (perhaps because we are teetering on that 6 month mark) but the average sale price only increased by about $3,000 over last month’s numbers. However, this is not a bad thing – prices are up slightly.
4. There were 1,732 buyers this month and 2,031 in August. I’m a bit surprised this number dropped a little but think that with interest rates hitting 3.875% last week, you’ll see the number of buyers jump next month.
Want more Tampa Real Estate Stats for the month of September, broken down by price ranges and more? Click here.


Leave a Reply