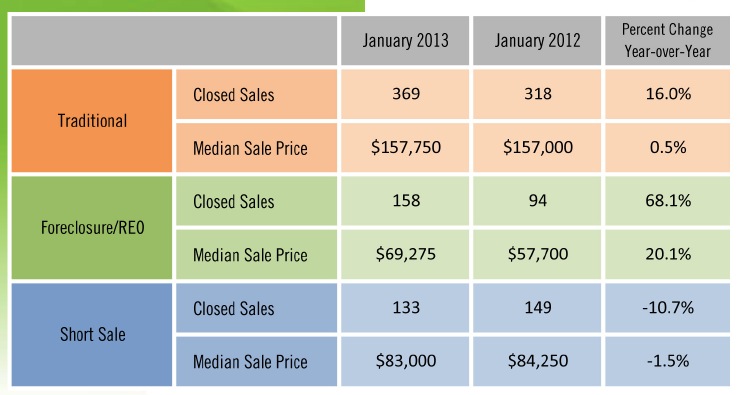
 Unfortunately our real estate board seems to run about a month behind in releasing statistics. Here it is the end of February – and we finally have January’s stats – yay! But I always think its interesting to see where we are compared to months and years past. The above graph shows our figures in Pinellas County in January 2013 compared with January 2012. As you can see we are generally closing more sales across the board.

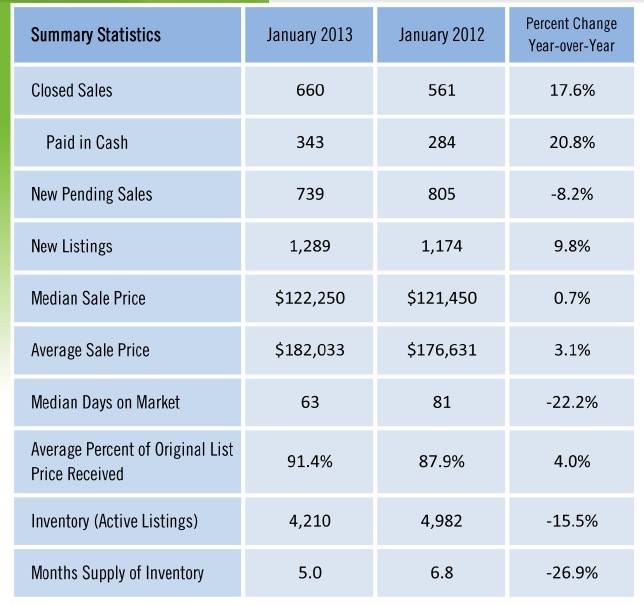
The graph above illustrates that days on market are fewer, prices are creeping up, and inventory is down overall in Pinellas County.

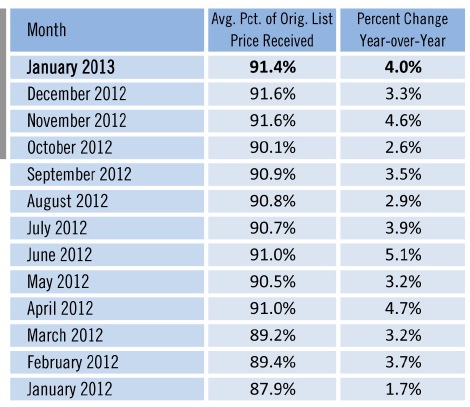
As compared to last year, Pinellas County homeowners are receiving offers closer to their asking price – an average of 91.4% of list price. My average as an agent is 96% – something to consider when listing your home. 😉

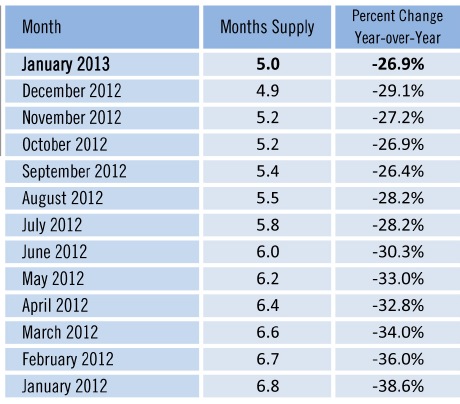
Our month’s supply is down to just 5 months – and is considered a buyer’s market (when under 6 months supply). Buyers are out there, but listings are becoming more scarce! I’ve recently sold 2 of my listings in under 48 hours – its getting crazy out there!


Leave a Reply